
Understanding data
Our grade 4 data and graphing worksheets review charts and graphs previously covered, with more challenging data sets including fractions. The last set of worksheets introduces probabilities.
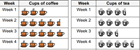
| Comparing Pictographs Analyze scaled pictographs. |
 |
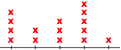
| Line Plots with Fractions Create line plots from data sets including fractions. |
 |
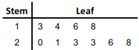
| Stem & Leaf Plots Create and analyze stem and leaf plots. |
 |
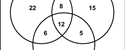
| Venn Diagrams (3 Sets) Analyze triple overlapping data sets. |
 |
| Pie Graphs with fractions Circle charts showing fractional values adding to one. |
 |
| Line Graphs Graph data changes over time. |
 |
| Reading Graphs Bar graphs, line plots, pie graphs, line graphs. |
 |
| Probability Determine the likelihood of events. |
 |

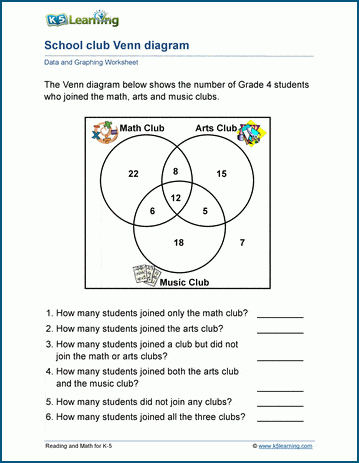
Sample Grade 4 Data and Graphing Worksheet