
Sorting, counting & thinking
These grade 1 worksheets introduce students to data and graphing, including sorting items into groups, tally marks and tally sheets, pictographs and bar charts.
| Same vs different Identify non-identical items. |
 |
| Belong / not belong Identify unrelated items. |
 |
| Sorting Data Sort items into 2-3 groups. |
 |
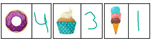
| Sort and Count Sort items into groups and count. |
 |
|
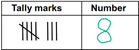
Tally Marks Tally marks to / from numbers. |
 |
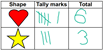
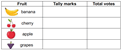
| Tally Sheets Use tally sheets to collect data. |
 |
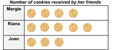
| Pictographs Use pictographs to represent data. |
 |
| Creating Bar Charts Create bar charts from data. |
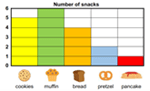 |
| Reading Bar Charts Read pre-prepared bar charts. |
|
| Bar Graphs Create and analyzing bar graphs. |
|
| Collecting Data Real world data collection projects. |
 |
| Blank Bar Charts Bar chart templates |
 |

Grade 1 Data & Graphing Worksheet Example