
Draw and analyze graphs
Our grade 3 data and graphing worksheets expand on early data collection, graphing and analyses skills. In particular, scaled graphs and more complex data sets are introduced.
| Graphing Tally Counts Make graphs from tally counts. |
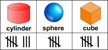 |
| Spin, Tally, Graph & Analyze Create and graph randomized data. |
 |
| Scaled Pictographs Analyze pictographs where symbols represent multiple items. |
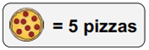 |
| Scaled Bar Graphs Draw and analyze scaled bar graphs. |
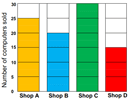 |
| Analyzing Scaled Bar Graphs Analyze scaled bar graphs without referring to a data table. |
|
| Interpreting Line Plots Interpret line plots without referring to a data table. |
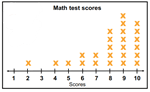 |
| Making Line Plots Create and analyze line plots from a data set. |
|
| Circle Graphs Create and analyze circle graphs (with / without fractions). |
 |
| Data collection Collect (survey, observe) data and graph it. |
 |
| Venn Diagrams Analyze double and triple Venn diagrams. |
 |
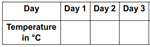
| Line Graphs Draw and analyze line graphs. |
 |
| Labelling Graphs Scale and label graphs. |
 |

Sample grade 3 data & graphing worksheet