
Introducing statistics
Our grade 5 data and graphing exercises extend previous graphing skills (double bar and line graphs, line plots and circle graphs with fractions) and introduce basic probability and statistics (range, mode, mean, median).
|
Double bar graphs Create & analyze double bar graphs. |
 |
|
Double line graphs Create & analyze double line graphs. |
 |
|
Line plots with fractions Make line plots with fractional values. |
 |
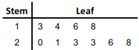
| Stem and leaf plots Create, read and analyze stem & leaf plots. |
 |
|
Circle graphs Interpret circle graphs using fractions. |
 |
|
Probability Calculate simple probabilities as fractions. |
 |
|
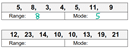
Range & mode Determine the range and mode of simple data sets. |
 |
|
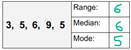
Range, median & mode Find the range, median & mode of simple data sets. |
 |
|
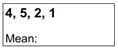
Mean Calculate the mean (average) of a data set. |
 |
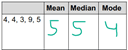
| Mean, median and mode Describe a data set by its mean, median and mode. |
 |

Grade 5 data and graphing worksheet