
Creating and reading graphs
Our grade 2 data worksheets emphasize using graphs to represent data. Students practice creating and / or reading pictographs, line plots, bar graphs, pie charts, line graphs and simple Venn diagrams.
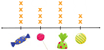
| Sort and Count Sort items into 4 groups. |
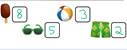 |
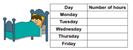
| Tally Sheets Count and group with tallies. |
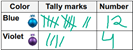 |
| Pictographs Display data with picture graphs. |
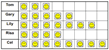 |
| Line Plots Create and read line plots. |
 |
| Bar Graphs Create bar graphs. |
 |
| Analyzing Bar Graphs Read bar graphs. |
|
| Creating Pie Charts Draw pie charts from data. |
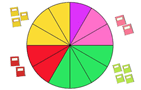 |
| Reading Pie Charts Analyze pre-prepared pie charts. |
|
| Venn Diagrams Create Venn diagrams (2 circles). |
 |
| Line Graphs Draw and read line graphs. |
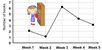 |
| Data Collection Collect and graph data. |
 |

Sample Grade 2 Data & Graphing Worksheet