
Previously we showed you how to find the mean of a bar graph and the mode of a bar chart. Now, we’ll tackle how to find the median of a bar graph.
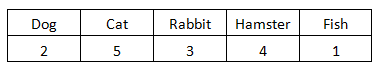
We'll use the same example. Students were were surveyed on what pets their families had. Here are the results:
What is the median of a bar chart?
Median means in the middle. So, the median is the middle number in the data set. However, we need to pay attention to one more thing before we point to the middle column in the below bar chart.

We first need to order the numbers from least to greatest.
The numbers ordered in our example are:
1 fish 2 dogs 3 rabbits 4 hamsters 5 cats
The median in this case is 3.
Also note, if there are two middle numbers, the median is the mean of these two numbers.
Let’s use a different example. Students spent the following on candy:
$1 $1 $2 $3 $4 $4 $4 $5
The two median numbers are $3 and $4. So we’ll have to work out the mean of these two numbers:
$3 + $4 = $7
$7 ÷ 2 = $3.50
The median for the money students spent on candy is $3.50.