What is a bar graph?
When you want to show relative sizes of a group of things, it’s a good idea to show them in a bar graph. A bar graph is a display of data using bars of different heights.
Let us show you an example.
Say, you asked your classmates what pets they have. Let’s say the results look like this:
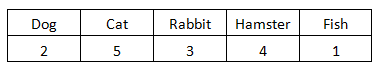
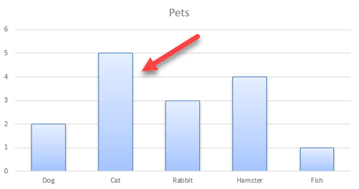
The results are easier to read in a bar graph, also called a bar chart. Here’s what the pets results look like in a bar graph:

What is mode?
In math terms, the mode is the most commonly occurring data item within a set of numbers. More simply put, the mode is the item which appear most often.
How do you find the mode of a bar graph?
Each bar indicates how many there are of each item and we are looking for the one item that appears most often. The mode of the bar graph would, therefore, be the item that has the highest bar.
In our example bar chart, the mode would be ‘cat’ as that item appears the most often: 5 times.