
In a previous post we showed you how to work out the mode of a bar chart, also called a bar graph. This time, we’ll look at how to work out the mean of a bar chart.
Let’s use the same example. A group of students were surveyed on what pets their families had. Here are the results:
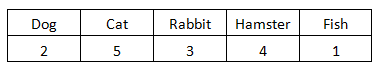
Survey results show in bar graph
Show in a bar graph, the results look like this:

What is the mean of a bar graph?
The mean is also called the average. To find the mean, we’ll need to:
1. Add all the numbers.
The numbers in this example are 2, 5, 3, 4, 1
2. Divide the sum by the number of addends.
The number of addends in this example are 5.
Here’s how to work out the mean of our example:
2 + 5 + 3 + 4 + 1 = 15
15 / 5 = 3
The mean number of pets is 3.
Liked this post? Click to share!


