
What is a line graph?
A line graph is a visual way to show how data changes over time. It’s a graphical display of information that shows continuous change. In a line graph the data points connect.
For example, the number of packs of cookies a student sold from Monday to Friday.

What is a double line graph?
A double line graph shows how two data sets change over time. They are two lines that show continuous change of the two separate data sets. A double line graph is used to compare changes of growth in two trends in a period of time.
For example, the number of views of two separate videos over the span of a week that were uploaded to YouTube.

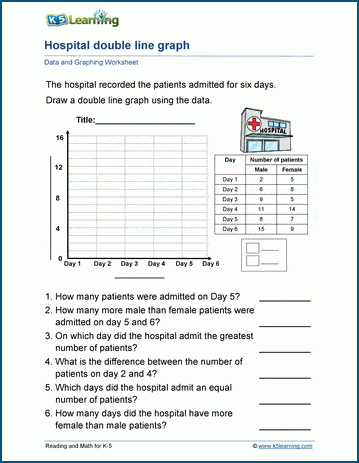
Practice double line graphs
In these worksheets, students create graphs with two data sets, as well as analyze double-line graphs.
Liked this post? Click to share!


